Optimizing Modulation Accuracy: A Step-by-Step Guide to Mastering Error Vector Magnitude (EVM) for Next-Gen Wireless
Introduction
Error Vector Magnitude (EVM) is the gold standard for quantifying modulation accuracy in modern wireless systems like Wi-Fi, LTE, and 5G NR. Understanding and improving EVM is critical because it directly impacts data throughput, signal quality, and overall system reliability. This step-by-step guide will walk you through the fundamentals of EVM, how to calculate it, why modulation schemes matter, what causes EVM degradation, and how to diagnose issues using constellation diagrams. By the end, you will have a clear, actionable framework to optimize modulation accuracy in your wireless designs.

What You Need
- Basic knowledge of digital communications (modulation, signal processing)
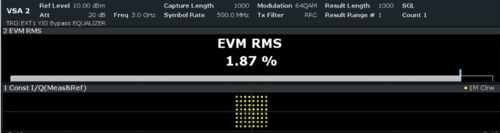
- Access to constellation diagram plots from a vector signal analyzer (VSA) or simulation tool
- Understanding of key parameters: ideal vs. measured constellation points, peak and RMS normalization
- Familiarity with EVM measurement equipment (e.g., spectrum analyzer with VSA capability)
- Optional: Sample IQ data files or live wireless test signals for practice
Step-by-Step Guide
Step 1: Understand What EVM Is and How It Is Calculated
EVM measures the distance between the ideal (theoretical) constellation point and the actual measured point in the IQ plane. This distance is typically normalized to either the peak amplitude (Peak EVM) or the root-mean-square (RMS) amplitude (RMS EVM). The result is expressed as a percentage or in decibels (dB). To calculate EVM:
- Collect the in-phase (I) and quadrature (Q) samples of the received signal.
- Identify the ideal symbol positions for the modulation scheme (e.g., 64-QAM, 256-QAM).
- For each symbol, compute the error vector: (I_measured - I_ideal, Q_measured - Q_ideal).
- Calculate the magnitude of each error vector, then average (RMS) or take the maximum (peak) over all symbols.
- Normalize by the reference amplitude (RMS of ideal constellation points for RMS EVM, or maximum amplitude for Peak EVM).
- Convert to percentage or dB using: EVM (dB) = 20 * log10(EVM_rms).
Lower EVM means higher modulation accuracy, which enables higher data rates and better link reliability.
Step 2: Learn How Digital Modulation Works and Why It Matters
Modulation schemes like ASK, FSK, PSK, APSK, and QAM encode digital bits into analog signals. Higher-order schemes (e.g., 1024-QAM) pack more bits per symbol, increasing throughput, but they also require tighter accuracy because constellation points are closer together. Four key modulation families affect EVM:
- ASK (Amplitude Shift Keying): Uses amplitude changes; susceptible to gain errors.
- FSK (Frequency Shift Keying): Uses frequency changes; less sensitive to amplitude noise but requires accurate frequency.
- PSK (Phase Shift Keying): Relies on phase; phase noise directly degrades EVM.
- QAM (Quadrature Amplitude Modulation): Combines amplitude and phase; most demanding on both.
When designing a system, choose the modulation order as high as your EVM budget allows. A higher modulation order (e.g., 256-QAM vs. 64-QAM) requires roughly 3-4 dB lower EVM for the same bit error rate.
Step 3: Examine What Causes Degraded EVM in Real-World Systems
Four main categories contribute to poor EVM:
- Amplitude effects: Amplifier compression (non-linearity), thermal noise, and frequency response ripple distort the signal envelope.
- Phase effects: Phase noise from local oscillators introduces random phase jitter, rotating constellation points.
- I/Q imperfections: Gain imbalance (different I and Q path gains) and quadrature error (non-90° phase shift) cause constellation skew and warping.
- Configuration issues: Incorrect sampling timing, filtering mismatch, or improper equalizer settings can all increase EVM.
To diagnose which category is dominant, move to Step 4 and use visual analysis of the constellation diagram.
Step 4: Diagnose Modulation Impairments Using Constellation Diagrams
Constellation diagrams provide a visual fingerprint of EVM impairments. Here’s how to read common patterns:
- Phase noise: Points appear as spreading arcs or radial smearing around the ideal positions, especially for outer corners.
- Amplifier compression: Outer constellation points are pulled inward (compressed), while inner points remain relatively stable.
- Additive noise: Points form a diffuse cloud centered on ideal positions (circular).
- In-band spurious: Concentric rings or secondary clusters appear around each symbol, often due to LO leakage or mixing products.
- I/Q gain imbalance: The constellation becomes elliptical – wider along one axis.
- Quadrature error: The constellation tilts so that perfect squares become parallelograms.
Once you identify the pattern, you can take corrective action: reduce gain for compression, improve phase-locked loop design for phase noise, or calibrate I/Q modulator offsets for imbalance.
Tips for Mastering EVM
- Start with a clean reference: Always measure your own transmitter’s EVM under ideal conditions (e.g., lower power, no interference) to establish a baseline.
- Normalize correctly: Ensure you are using the same normalization method (Peak vs. RMS) as your standard specification (e.g., 3GPP for LTE/5G defines RMS EVM relative to peak constellation amplitude).
- Average over enough symbols: For statistical significance, capture at least 1000 symbols; for high-order QAM, capture even more.
- Check EVM across frequency: EVM can vary across the channel bandwidth due to analog filtering. Measure at several different frequencies.
- Use EVM to set signal quality limits: In system design, define a minimum allowed EVM (e.g., -30 dB for 256-QAM) and trigger alerts if exceeded.
- Combine with other metrics: EVM tells you signal quality, but also monitor adjacent channel power (ACP) and error vector spectrum for a complete picture.
- Iterate between simulation and measurement: Simulate EVM in software first (e.g., using MATLAB/Simulink) to understand ideal performance, then compare with hardware measurements.
Remember: mastering EVM is an ongoing process. As wireless systems evolve to higher modulation orders and wider bandwidths, continuous improvement of EVM will be essential to unlock their full potential. Use this guide as your roadmap to achieve next-generation modulation accuracy.
Related Articles
- Everything You Need to Know About Carbon Brief's Summer Journalism Internship
- Breaking: Over Half of U.S. Workers Actively Job-Hunting Despite Gloomy Market – Therapist Reveals 'Third Way' to Find Fulfillment
- Mastering macOS App Development: Your Complete Beginner's Guide
- How Cloudflare's 'Code Orange: Fail Small' Made the Network Stronger for You
- 9 Proven Strategies to Land Your First Cloud or DevOps Job
- Empowering Educators: ISTE+ASCD Announces 2026-27 Voices of Change Fellows
- Mastering Data Normalization for Robust Machine Learning Performance: A Step-by-Step Guide
- How to Integrate World-Class Online Learning into National Higher Education: A Step-by-Step Guide for Education Ministries