Housing Market Power Shift: Where Inventory Favors Buyers vs. Sellers
Understanding the dynamics of housing inventory is crucial for buyers and sellers navigating today's market. While national inventory remains below pre-pandemic levels, significant regional variations create distinct advantages for different players. This Q&A explores the key trends in active listings, the balance of power between buyers and sellers, and which states offer the most—and least—options for home shoppers.
1. How does active housing inventory affect buyer and seller power?
Active listings reflect the number of homes currently for sale. A rapid increase in inventory often signals that homes are sitting longer, giving buyers more negotiating power and potentially leading to softer prices. Conversely, when inventory declines sharply, sellers gain an advantage as demand outstrips supply. Over the past several years, national inventory has gradually risen from pandemic-era lows, shifting power from sellers toward buyers, though this change is uneven across regions. Markets with inventory above pre-pandemic 2019 levels have seen weaker price growth, while those with persistently low inventory have maintained stronger resilience.
2. What are the current national inventory trends?
As of April 2026, national active listings stood at 1,002,935, up 4.6% year-over-year from April 2025. However, the pace of growth has slowed dramatically from a year ago, when the year-over-year increase was 30.6%. This suggests that after a period of rapid inventory expansion, the market is stabilizing. Despite this increase, inventory remains 11.8% below April 2019 levels, indicating that the market hasn't fully returned to pre-pandemic conditions. The current trajectory, if sustained, could see inventory reach around 1.05 million by April 2027, but that's not a given.
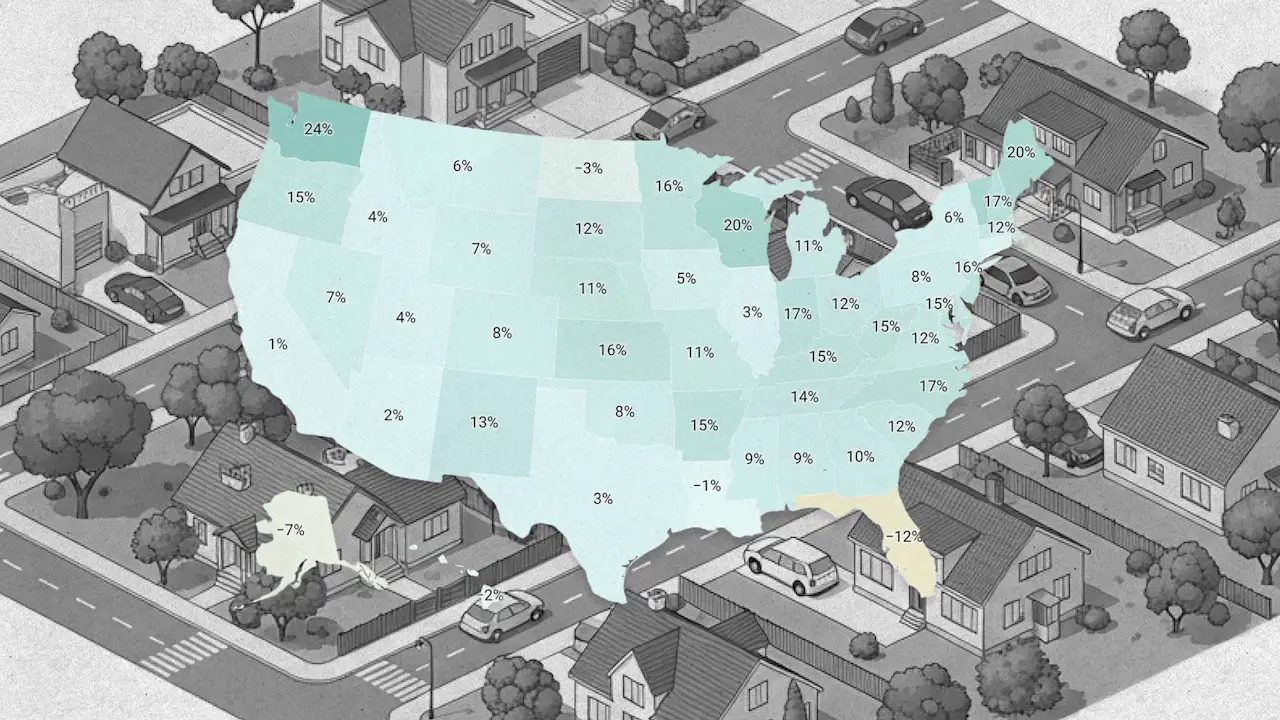
3. Which states currently have the most housing inventory for buyers?
States like Florida, Texas, and Arizona have experienced significant inventory growth, often exceeding pre-pandemic levels. For example, Florida's active listings have risen substantially due to a combination of new construction and a cooling of pandemic-era demand. These markets offer buyers more choices and greater negotiating leverage, with homes staying on the market longer. Conversely, states in the Midwest and Northeast, such as New Hampshire and Massachusetts, still have inventory far below 2019 levels, maintaining seller-friendly conditions.
4. Where are inventory levels still favoring sellers?
Markets with the tightest inventory relative to pre-pandemic 2019 are concentrated in the Northeast and Midwest. For instance, active listings in New Hampshire were more than 40% below April 2019 levels as of early 2026. Similarly, parts of the Northeast, including Vermont and Maine, continue to see limited supply. These regions have experienced relatively resilient home price growth despite national cooling. The scarcity often results from low turnover and limited new construction, keeping sellers in control.
5. How has the balance of power shifted since the pandemic boom?
During the pandemic housing boom of 2021-2022, inventory hit historic lows (e.g., 379,978 in April 2022), giving sellers immense power. Since then, inventory has gradually recovered, shifting leverage toward buyers. The national aggregated market now sits in a more balanced equilibrium. However, this shift is not uniform: regions with the largest inventory gains (like the South and parts of the West) have seen more pronounced buyer advantages, while the Northeast and Midwest remain seller-friendly due to limited supply.
6. Why has the year-over-year inventory growth slowed recently?
The slowdown in year-over-year inventory growth from 30.6% (April 2024 to April 2025) to just 4.6% (April 2025 to April 2026) suggests a cooling of the inventory rebound. Possible reasons include a stabilization of seller listings, a pickup in buyer demand absorbing new supply, or both. Additionally, some potential sellers may be waiting for lower interest rates, reducing the flow of new listings. This moderation points to a less volatile market where the supply-demand imbalance is no longer worsening rapidly.
7. What does the future hold for active inventory and pricing?
If current inventory growth continues at the recent pace (~43,684 homes per year), active listings could reach about 1.05 million by April 2027. However, this is a mathematical projection, not a forecast. Factors like mortgage rates, economic conditions, and homebuilder activity will influence actual outcomes. Markets with above-pre-pandemic inventory may see further price softening, while tight markets could keep prices elevated. Buyers should monitor local inventory trends for negotiating power, while sellers in low-inventory areas may still command premium prices.
Related Articles
- iOS 27 AI Leaks: Writing Tools, Wallpapers, and Smarter Shortcuts
- Cisco Unveils Open-Source Solution to Trace AI Model Origins Amid Rising Security Threats
- Ars Technica Report: Why the Command Line Refuses to Die
- 10 Shocking Facts About Alaska’s 500-Meter Tsunami That No One Heard About
- The Undying Dungeons: How Community Passion Keeps Roguelikes Alive for Decades
- AI Agents Reshape Every Phase of Software Development, New Industry Report Reveals
- 10 Powerful Features in MerMark Editor v0.2.0 You Should Know About
- Building a Multi-Agent AI System with Planning, Tools, and Self-Correction Using OpenAI